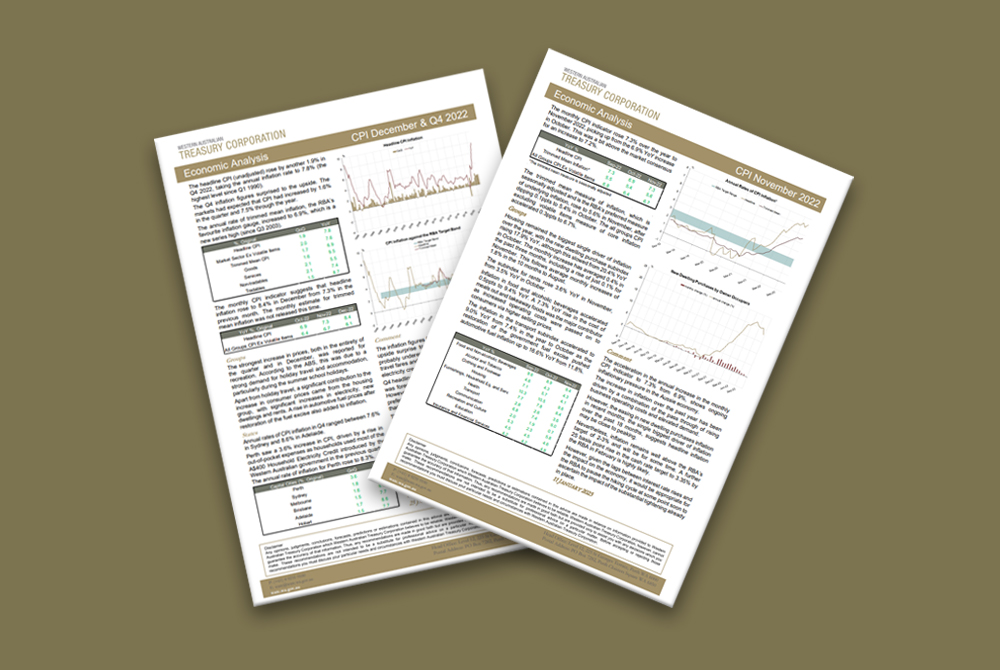
The Consumer Price Index (CPI) measures inflation through the change in prices that households pay for goods and services. The Reserve Bank of Australia targets a CPI inflation rate of 2-3 per cent. This note presents an overview and commentary on the most recent CPI data.
- 25 Jun 2025 CPI May 2025
The monthly CPI indicator suggested that the annual rate of consumer price inflation fell by 0.3ppts to 2.1% in May. This was a downside surprise to the market participants, who expected a smaller 0.1ppts decline to 2.3%. Annual trimmed mean inflation, which is the RBA’s favoured measure of underlying inflation, fell 0.4ppts to 2.4%, which is the lowest level since November 2021.
- 28 May 2025 CPI April 2025
The monthly CPI indicator suggested that the annual rate of consumer price inflation in April remained at 2.4% for the third straight month. The underlying inflation measures ticked up in April, but remained within the RBA target range of 2–3%.
- 30 Apr 2025 CPI March 2025
The headline CPI rose by 0.9% in Q1 2025, while the annual rate of headline CPI inflation was unchanged at 2.4%. Annual trimmed mean CPI inflation, which is the RBA’s favourite underlying inflation gauge, declined to 2.9% in Q1, thus coming back to the RBA target range.
- 26 Mar 2025 CPI February 2025
The monthly CPI indicator suggested that the annual rate of consumer price inflation ebbed 0.1ppts to 2.4% YoY in February, against market expectations of no change. Annual trimmed mean inflation, which is the RBA’s favoured measure of underlying inflation, declined 0.1ppts to 2.7%, which is very close to the mid-point of RBA target range of 2-3%.
- 26 Feb 2025 CPI January 2025
The monthly CPI indicator suggested that the annual rate of CPI inflation remained at 2.5% YoY in January, against the market expectations of a 0.1ppts increase to 2.6%. Annual trimmed mean inflation, which is the RBA’s favoured underlying price growth gauge, also picked up 0.1ppts to 2.8%.
- 29 Jan 2025 CPI December & Q4 2024
The headline CPI (unadjusted) rose 0.2% in Q4 2024, taking the annual inflation rate 0.4ppts lower to 2.4% (mkt exp. 0.3% QoQ and 2.5% YoY).
Quick Links
Banner image top - Fremantle Markets, Fremantle. Image courtesy of Tourism Western Australia.

