
Latest Updates
A snapshot of the latest in economic indicators from our Economic Services team.- 02 Jul 2026 Trade Balance May 2026Australia’s seasonally adjusted goods trade balance turned back negative in May, declining by A$4.4b to a deficit of A$3.0b. This was a surprise to market participants, who expected that the goods trade surplus would widen to A$2.2b. The decrease in goods trade surplus was caused by both a 6.9% drop in exports and a 2.6% gain in imports.
- 01 Jul 2026 Building Approvals May 2026Dwelling approvals fell by a seasonally adjusted 1.1% in May, against expectations of a flat result; this followed a 0.2% decline in April. In contrast to the previous month, the fall in dwelling approvals was due to a 10.4% drop in dwellings other than houses, while private sector house approvals picked up by 2.8% after a slight decline in April.
- 25 Jun 2026 Household Spending May 2026Household spending rebounded by a seasonally adjusted 1.3% in May (mkt exp.: 0.5%), following a 1.1% fall in April. Annual household spending growth picked up by 0.4ppts to 5.1%.
All Economic Indicators
Select your preferred publication to find out more.- Balance of PaymentsRead more
Measuring economic transactions between Australia and the rest of the world.
- Building ApprovalsRead more
A breakdown of building work approved within Australia over the last month.
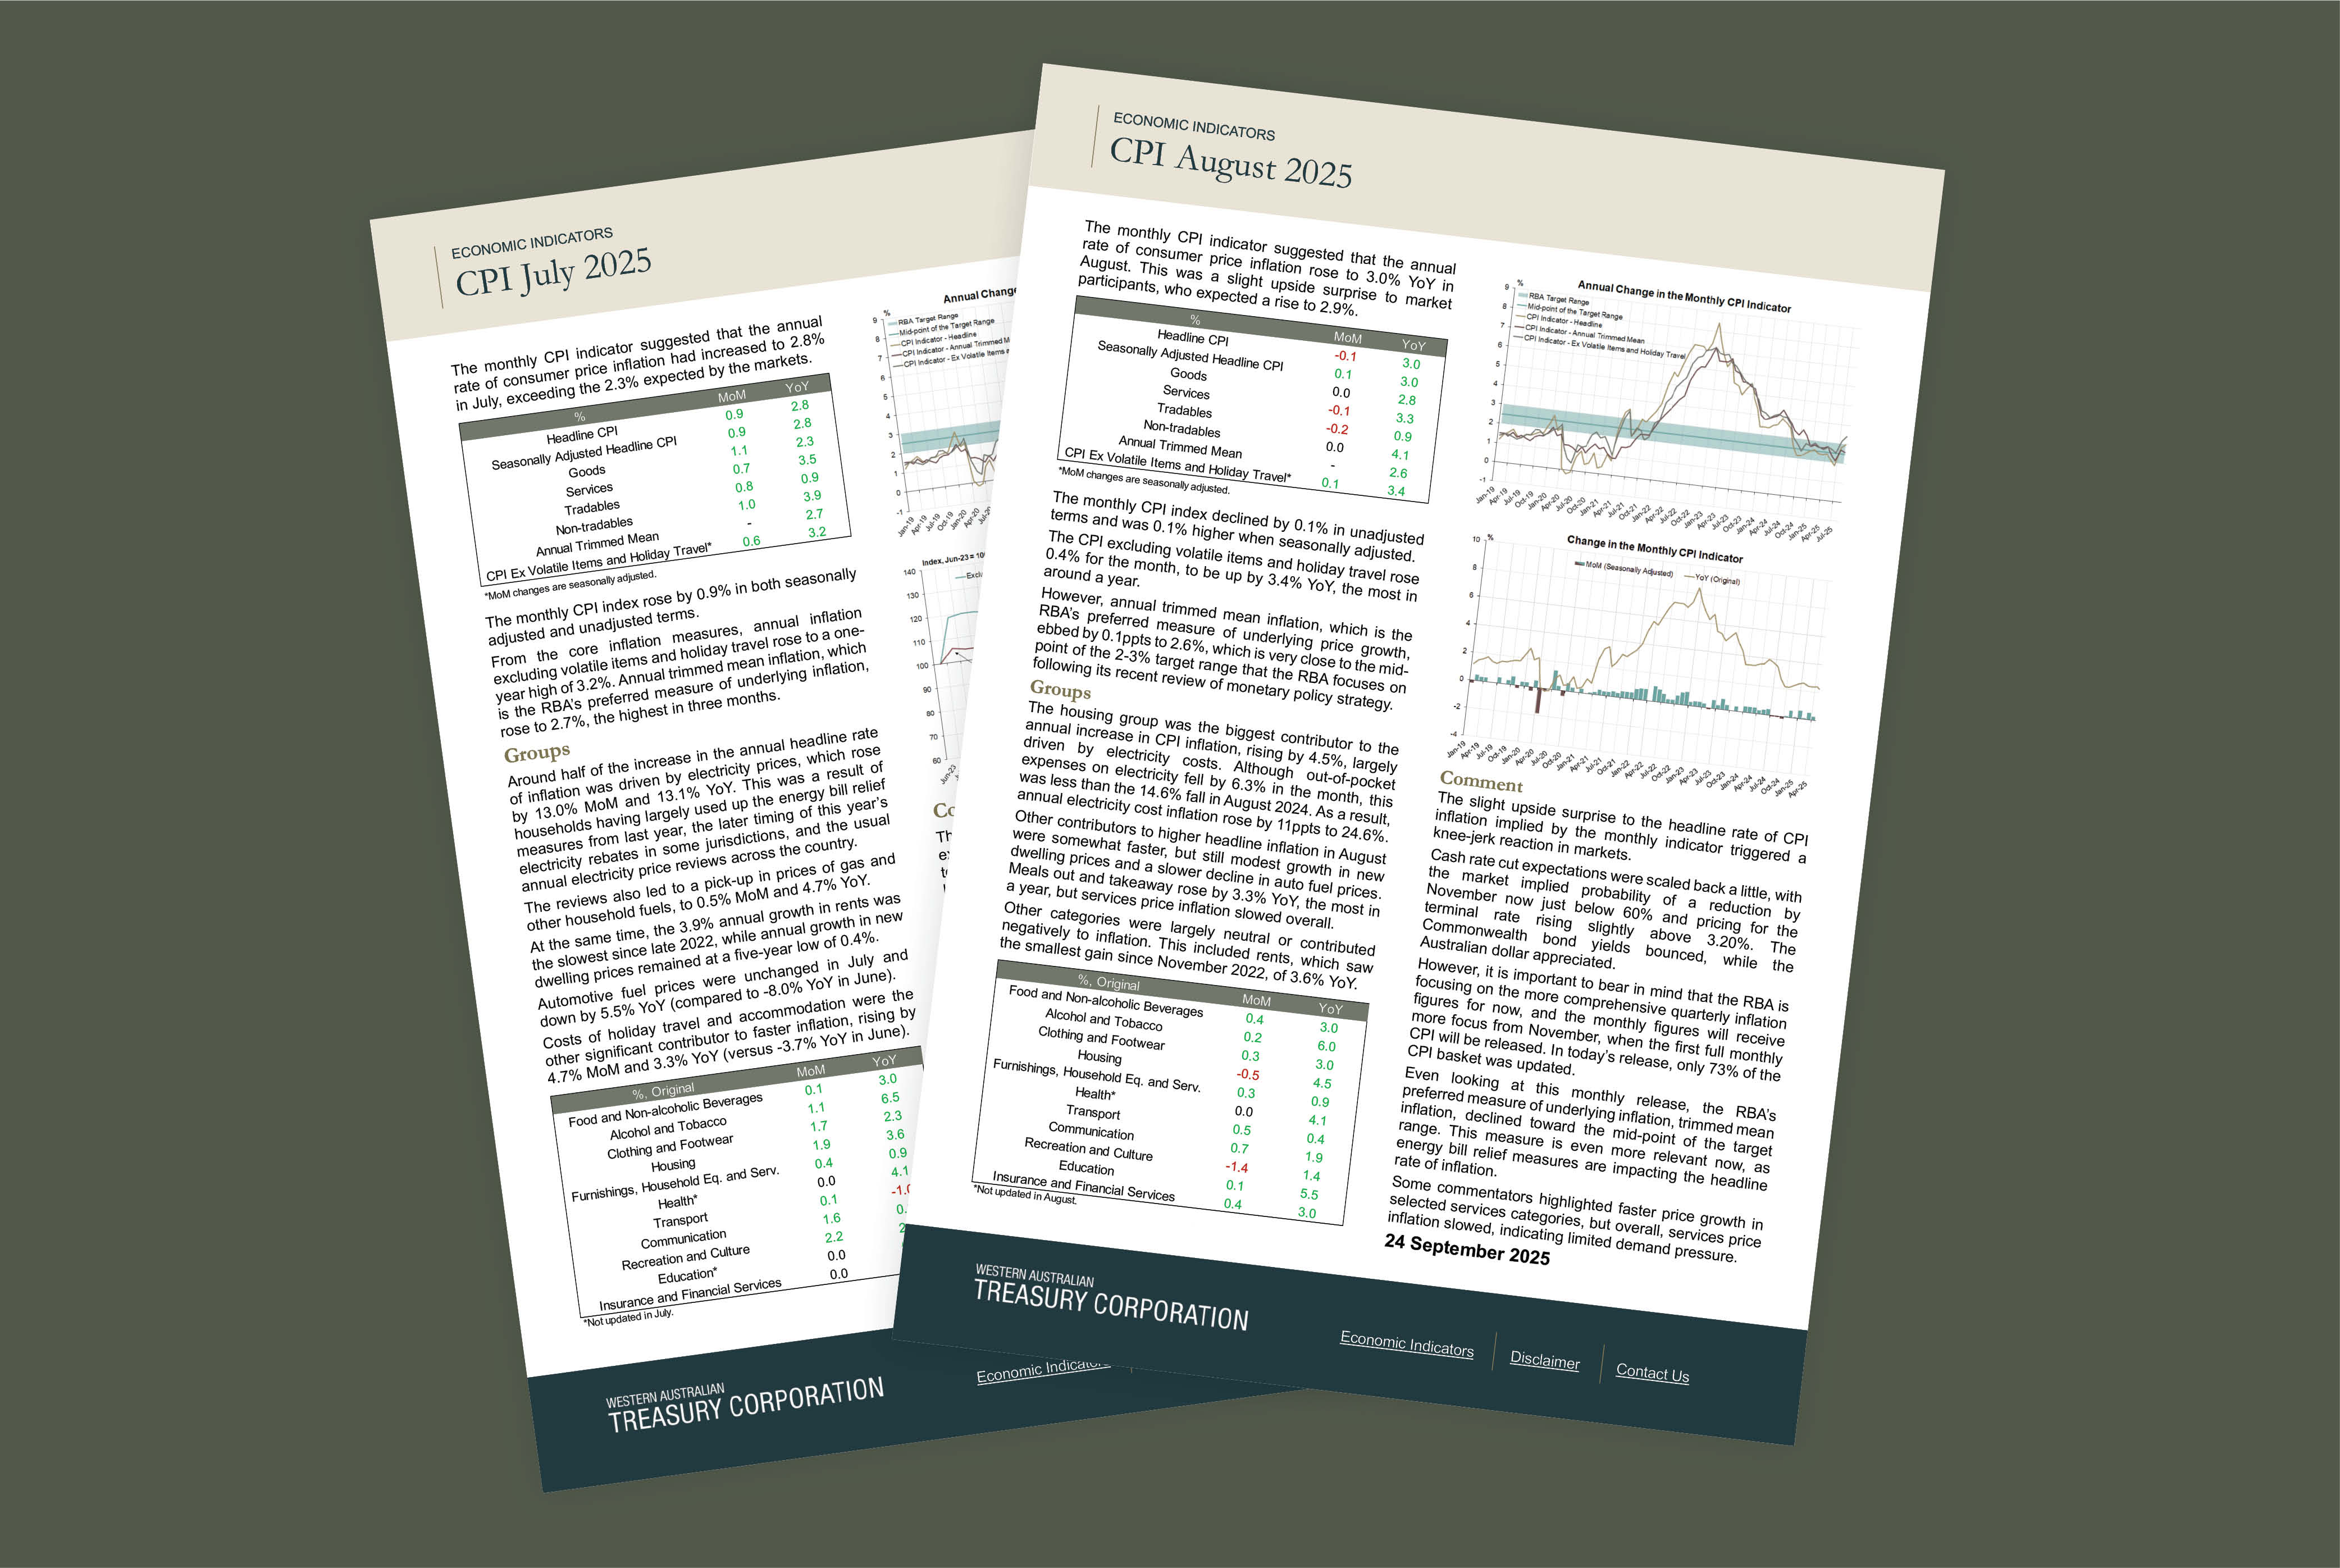
- CPI InflationRead more
The most recent data on consumer price inflation across Australia.
- EmploymentRead more
A snapshot of employment and participation within the Australian labour force.
- GDPRead more
Measures the total market value of all goods and services produced in Australia.
- Household SpendingRead more
Data on both monthly and quarterly household spending
- Trade BalanceRead more
A summary of developments in Australian foreign trade over the most recent month.
- WagesRead more
Measuring changes in wage price indices for individual industries and states.
External Financial Resources
Banner images:
Top - Port of Port Hedland. Image courtesy of Pilbara Ports Authority.
Below - North Quay Terminals, Fremantle. Image courtesy of Fremantle Ports.
Market Updates
Read our commentary and analysis on financial markets and the Australian and global economies.