
Latest Updates
A snapshot of the latest in economic indicators from our Economic Services team.- 07 Apr 2026 Household Spending February 2026Household spending rose by a seasonally adjusted 0.3% in February, the same as the previous month and slightly more than the 0.2% pencilled in by market consensus.
- 02 Apr 2026 Trade Balance February 2026Australia’s seasonally adjusted goods trade surplus rose to a seven-month high of A$5.7b in February. The increase in the goods trade surplus due to a 4.9% rise in exports and 3.2% decline in imports.
- 01 Apr 2026 Building Approvals February 2026Dwelling approvals surged a seasonally adjusted 29.7% in February, significantly more than the 5.5% increase pencilled in by the market consensus. The surge in seasonally adjusted approvals was mainly due to consents for the building of dwellings other than houses doubling over the month.
All Economic Indicators
Select your preferred publication to find out more.- Balance of PaymentsRead more
Measuring economic transactions between Australia and the rest of the world.
- Building ApprovalsRead more
A breakdown of building work approved within Australia over the last month.
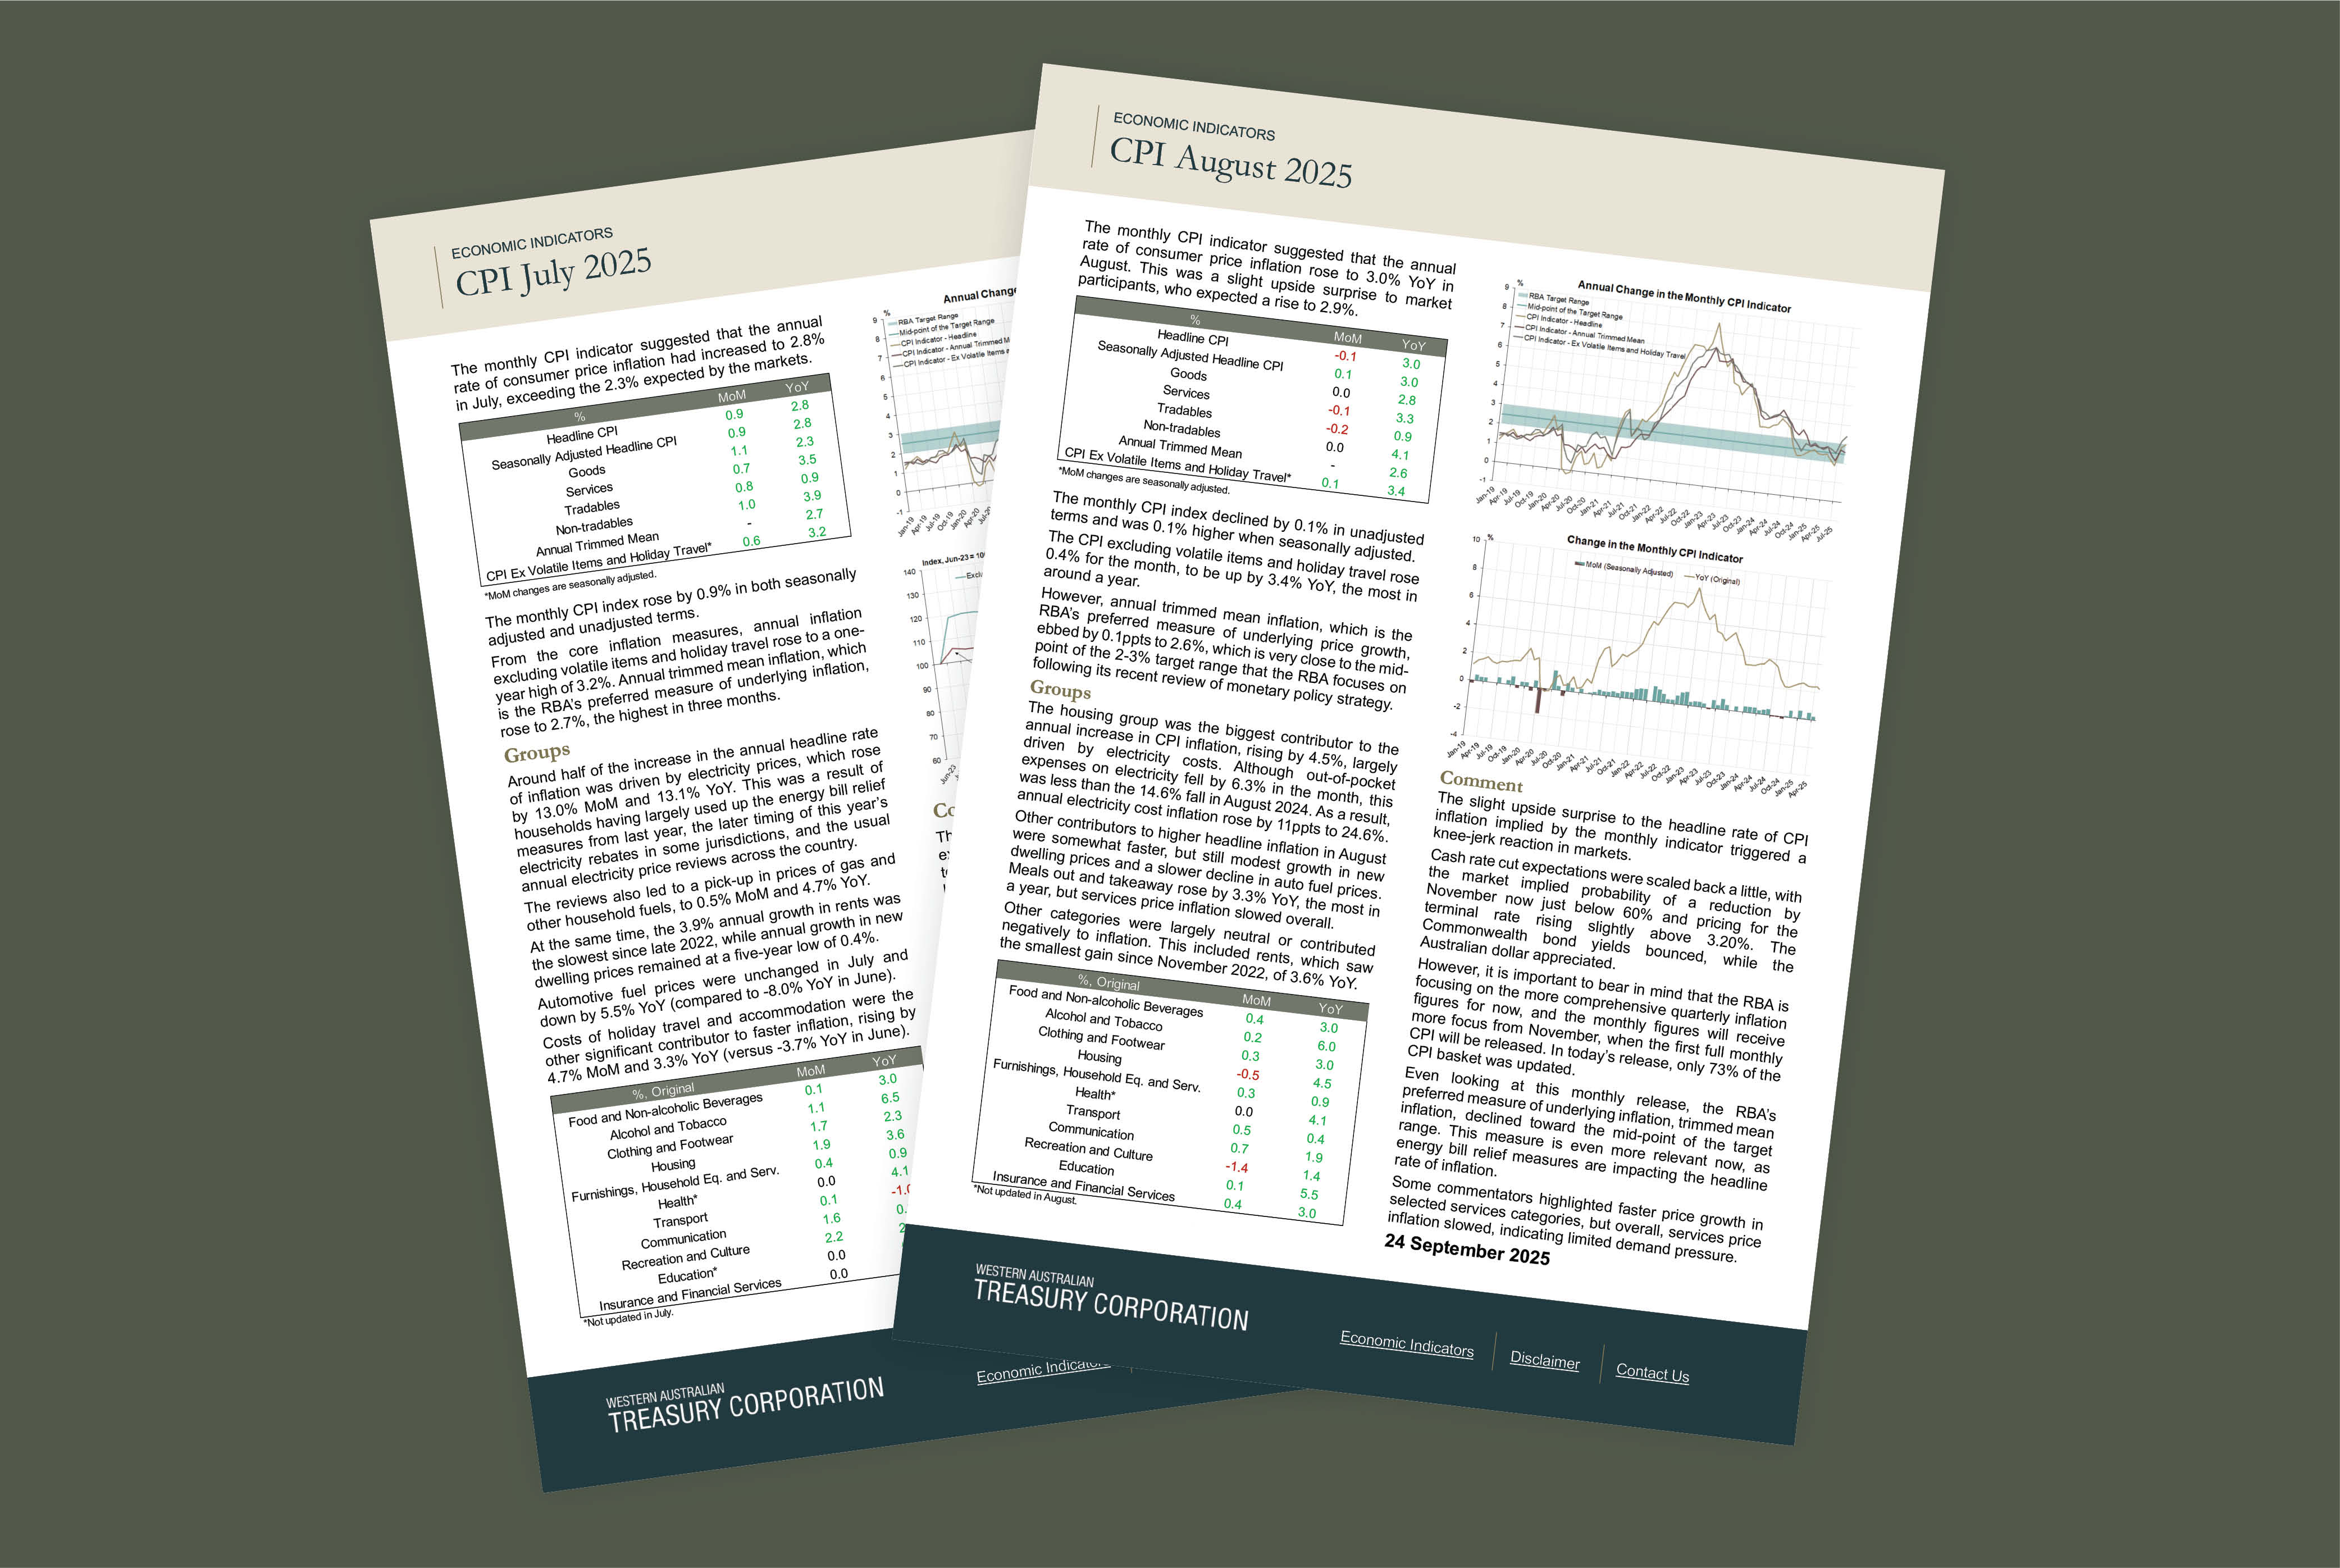
- CPI InflationRead more
The most recent data on consumer price inflation across Australia.
- EmploymentRead more
A snapshot of employment and participation within the Australian labour force.
- GDPRead more
Measures the total market value of all goods and services produced in Australia.
- Household SpendingRead more
Data on both monthly and quarterly household spending
- Trade BalanceRead more
A summary of developments in Australian foreign trade over the most recent month.
- WagesRead more
Measuring changes in wage price indices for individual industries and states.
External Financial Resources
Banner images:
Top - Port of Port Hedland. Image courtesy of Pilbara Ports Authority.
Below - North Quay Terminals, Fremantle. Image courtesy of Fremantle Ports.
Market Updates
Read our commentary and analysis on financial markets and the Australian and global economies.